Smart City Dashboard
A real-time IoT management dashboard designed for smart city administrators — enabling device monitoring, data analytics, and alert management across a 100 km urban radius.
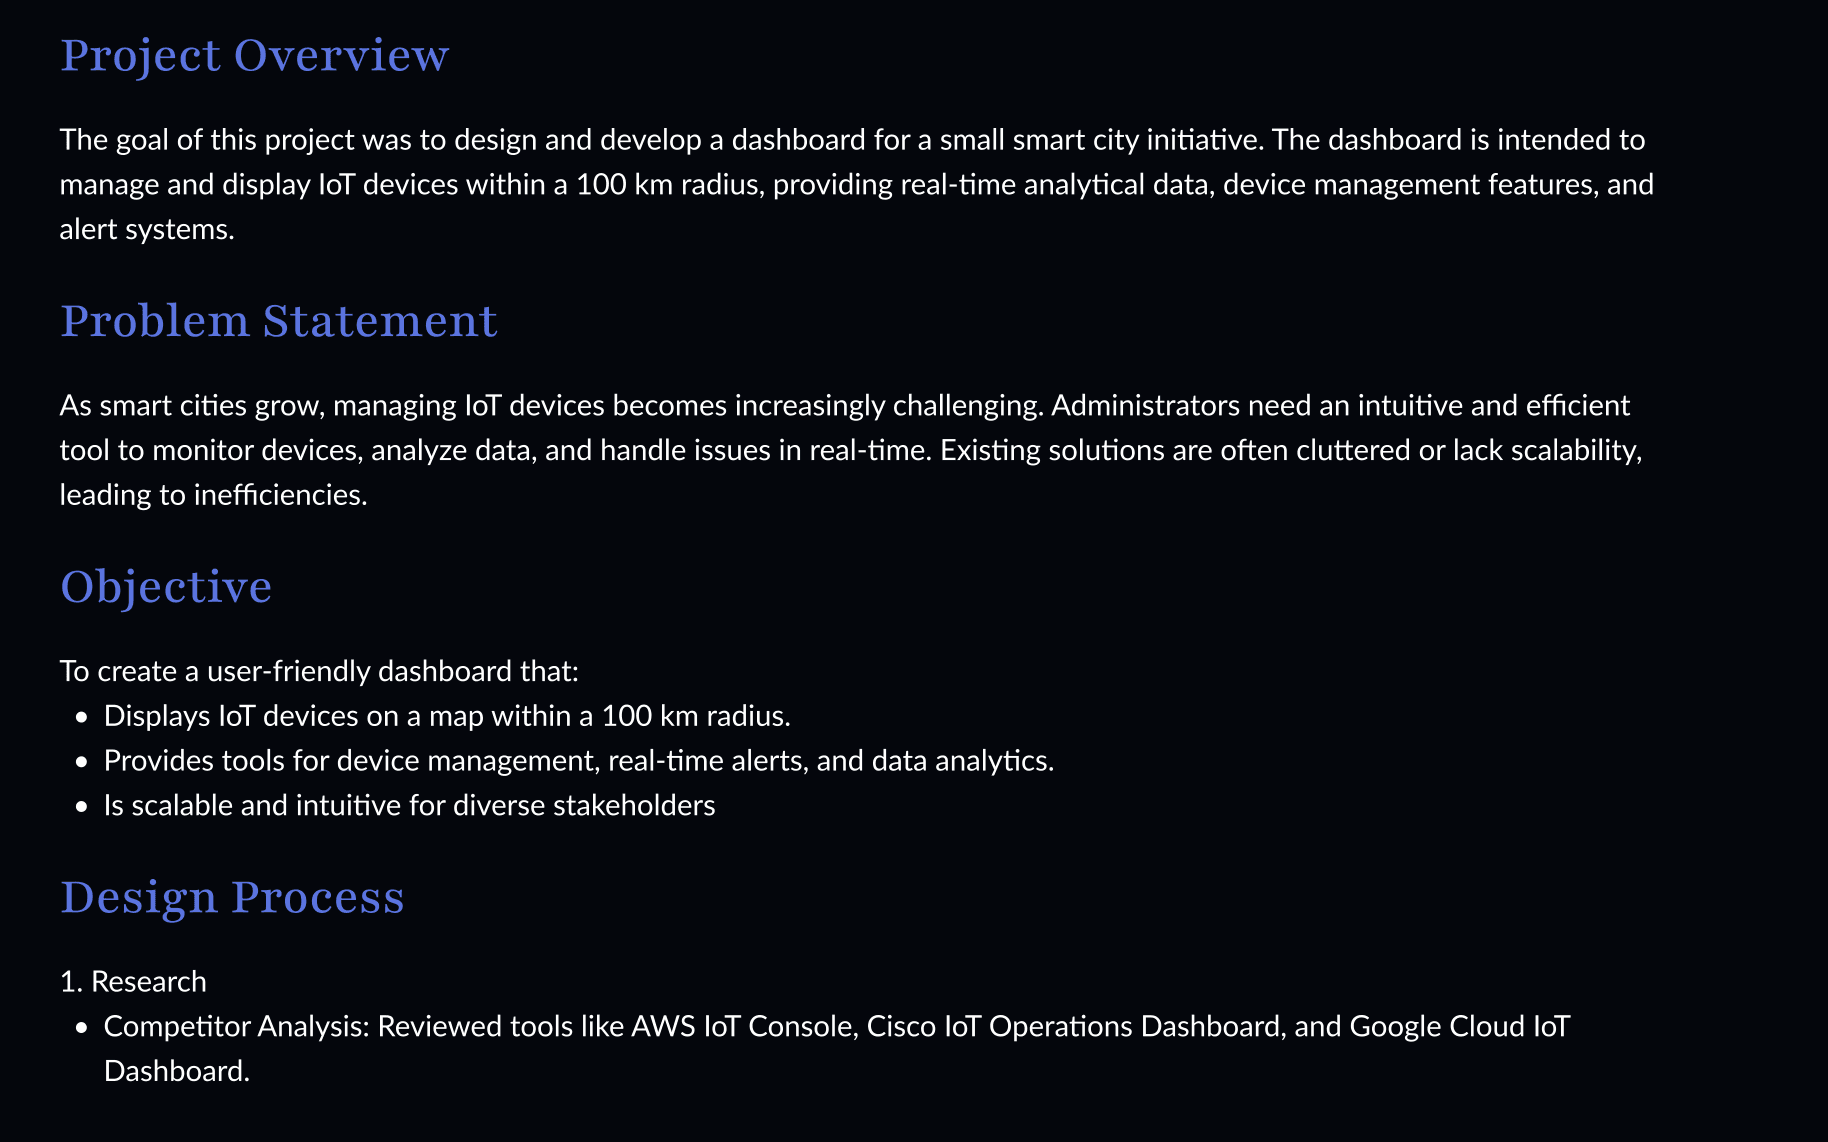
As smart cities scale, the complexity of managing hundreds of distributed IoT devices grows rapidly. Administrators need a single, intuitive interface to monitor device health, respond to real-time alerts, and analyse environmental data — without being overwhelmed. Existing tools were either too cluttered or lacked the scalability required for modern urban environments. This project set out to design a focused, user-friendly dashboard that brings together geospatial device management, environmental analytics, and proactive alerting — all in one cohesive dark-themed interface.
As smart cities scale, the complexity of managing hundreds of distributed IoT devices grows rapidly. Administrators need a single, intuitive interface to monitor device health, respond to real-time alerts, and analyse environmental data — without being overwhelmed. Existing tools were either too cluttered or lacked the scalability required for modern urban environments. This project set out to design a focused, user-friendly dashboard that brings together geospatial device management, environmental analytics, and proactive alerting — all in one cohesive dark-themed interface.
Client
Smart City Initiative
Services
UX Research, Wireframing, High Fidelity Design, Competitor Analysis and Data Visualisation
Industries
Urban Technology
Date
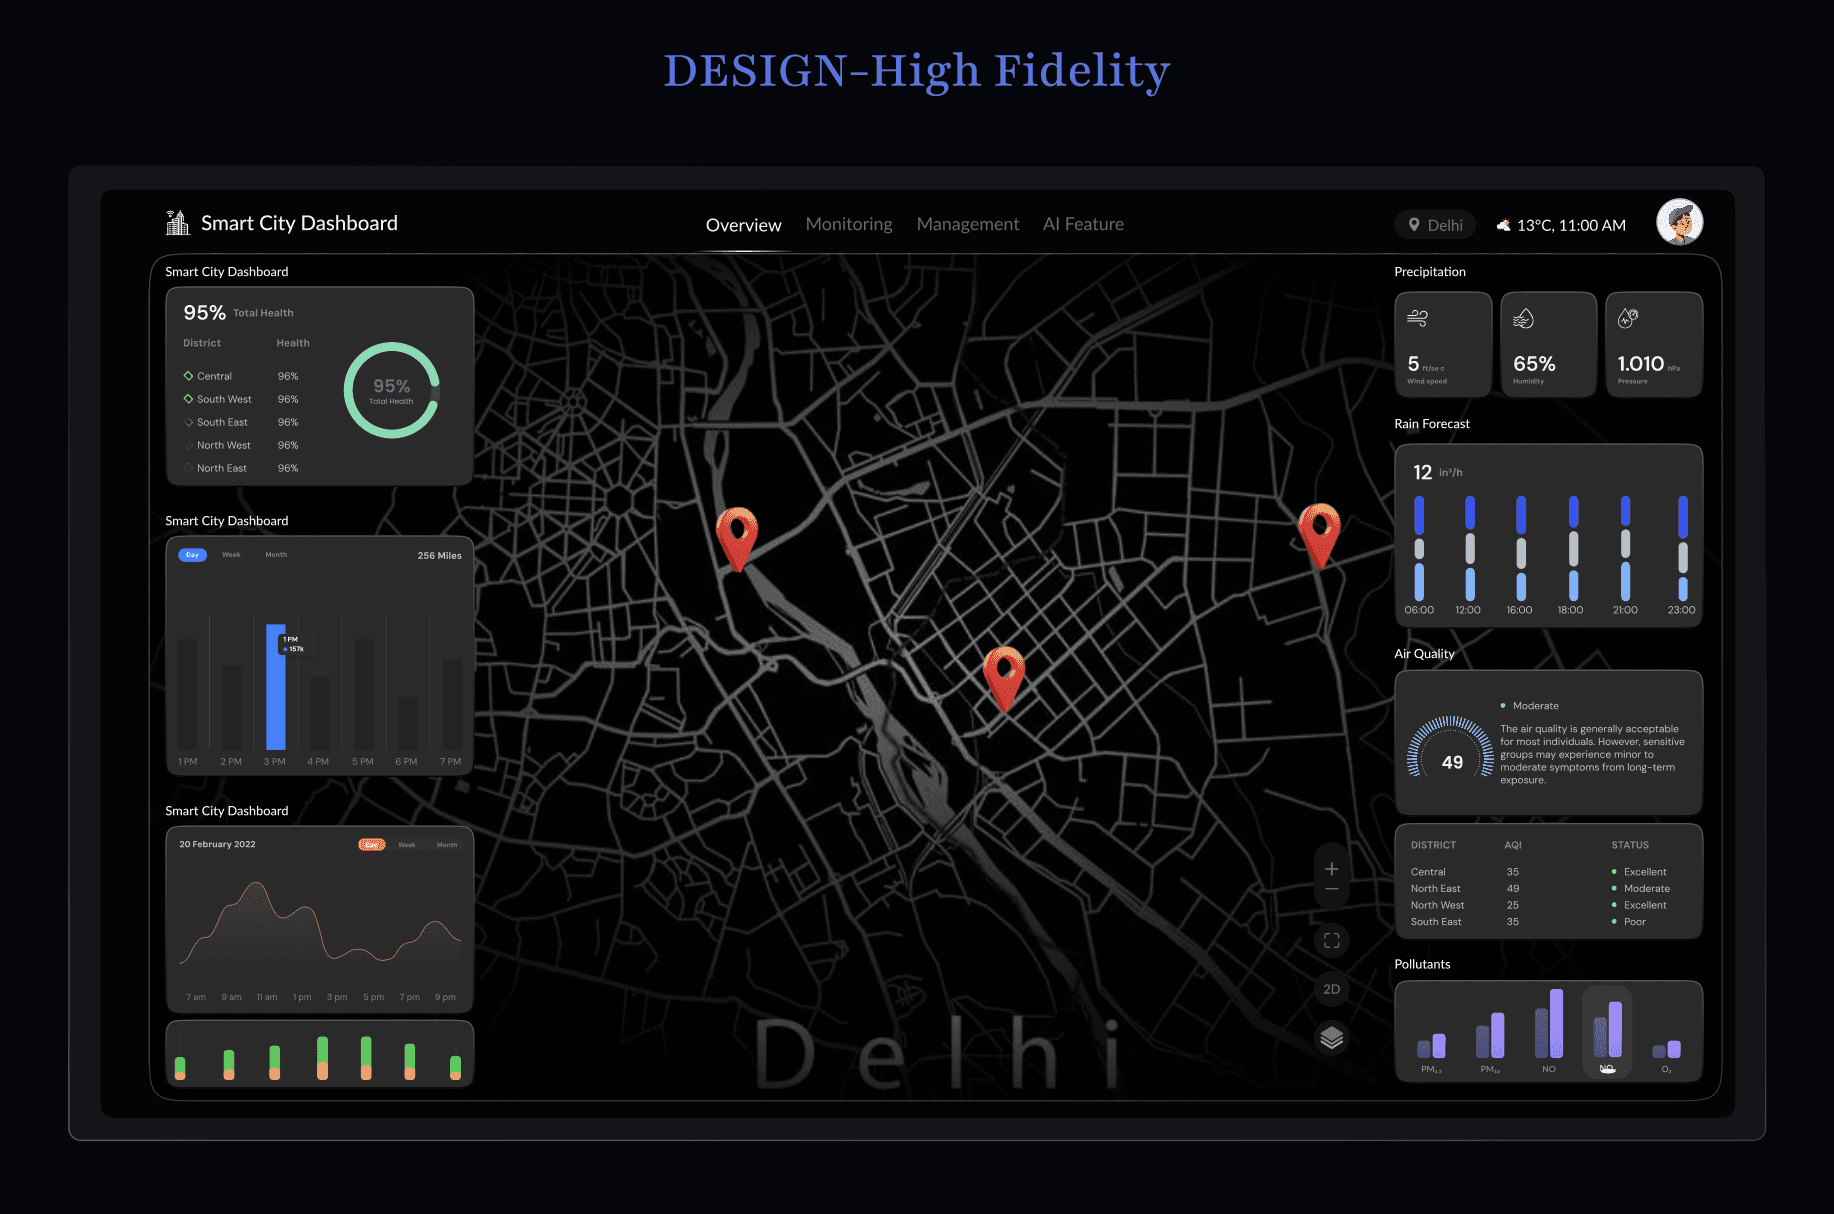
Interactive map with device pins, zoom/pan/filter controls, and red markers for critical alerts within a 100 km radius.
Interactive map with device pins, zoom/pan/filter controls, and red markers for critical alerts within a 100 km radius.

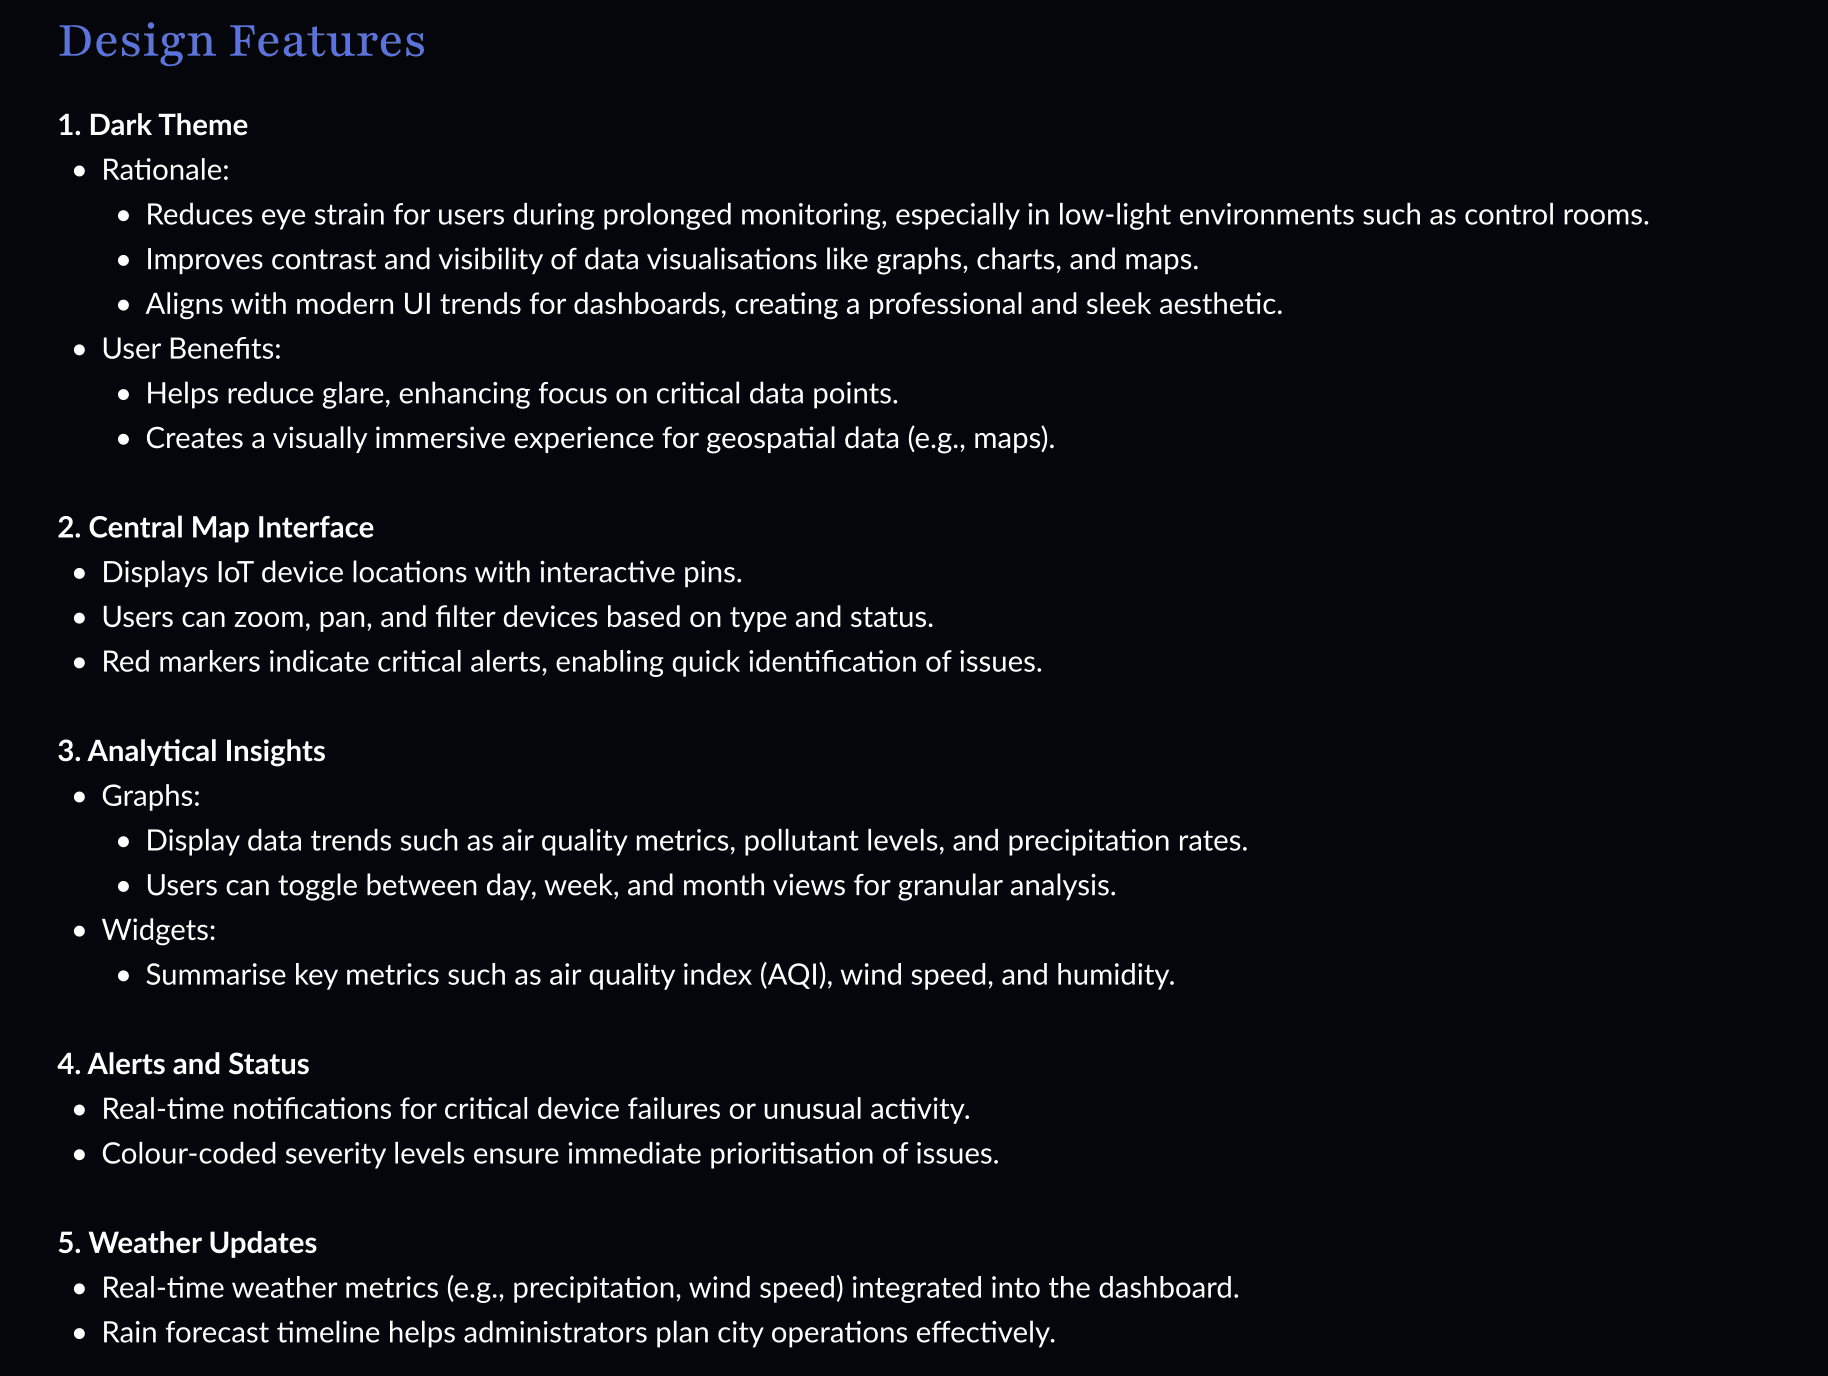

The Smart City Dashboard demonstrates how thoughtful UX design can transform complex, multi-source IoT data into clear and actionable information. By anchoring the design in real operator needs — fast triage, environmental awareness, and geospatial context — the solution addresses core urban management challenges while remaining flexible for future growth. It stands as a practical example of how design thinking bridges the gap between raw technology and real-world usability.
The Smart City Dashboard demonstrates how thoughtful UX design can transform complex, multi-source IoT data into clear and actionable information. By anchoring the design in real operator needs — fast triage, environmental awareness, and geospatial context — the solution addresses core urban management challenges while remaining flexible for future growth. It stands as a practical example of how design thinking bridges the gap between raw technology and real-world usability.
The Smart City Dashboard demonstrates how thoughtful UX design can transform complex, multi-source IoT data into clear and actionable information. By anchoring the design in real operator needs — fast triage, environmental awareness, and geospatial context — the solution addresses core urban management challenges while remaining flexible for future growth. It stands as a practical example of how design thinking bridges the gap between raw technology and real-world usability.